By Scarlett Barge
Many relationships we wish to study are not well captured by classic linear regression. In non-linear models, an increase in X can have different effects depending on the starting value of X. These models allow us to capture curvature, diminishing returns, and other patterns that linear models miss.
Polynomial Models
Polynomial models extend linear regression by including powers of X as additional variables. For example, a model may include X^2, or even higher-order terms such as X^3 and X^4, depending on the shape of the relationship.
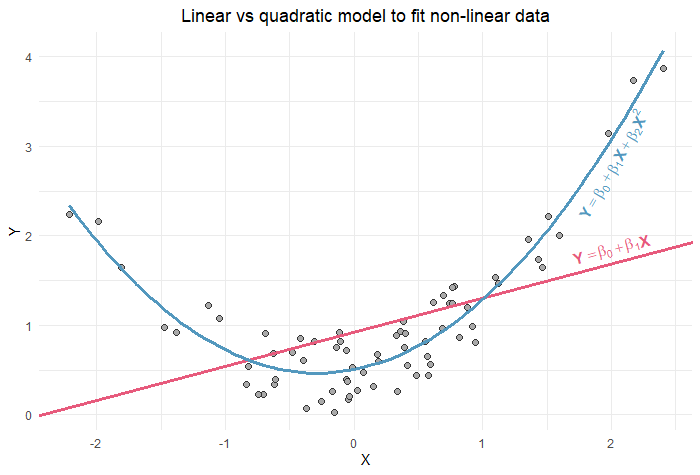

Determining whether a higher-order term is necessary is relatively straightforward. By performing a t-test on the coefficient of the higher-power term, we can assess whether it is statistically significant. If the coefficient is not significant, a lower-order polynomial, or even a simple linear model, may be more appropriate.
Logarithmic Models
Logarithmic transformations are useful because they often approximate percentage changes rather than absolute changes. These models are especially helpful when the proportional change in a variable is more meaningful than its raw increase. There are three common log-based models:
- Linear-Log Model: Y = ⍺ + ꞵlog(X) + ε
- A 1 percentage point increase in X is associated with a ꞵ change in Y.
- Log-Linear Model: log(Y) = ⍺ + ꞵX + ε
- A 1 unit increase in X is associated with a ꞵx100% change in Y.
- Log-Log Model: log(Y) = ⍺ + ꞵlog(X) + ε
- A 1 percentage point increase in X is associated with a ꞵ% change in Y.
Choosing among these models can be challenging. While R-squared can be used to compare the log-linear and log-log models as they have the same dependent variable in log(Y), it is not directly comparable to the linear-log model. Visual inspection of fitted values and residual plots is often a valuable complementary approach.
Real-World Example
Non-linear relationships appear frequently in real-world data. Consider the relationship between income and health. If someone earning $25,000 per year experiences a $25,000 increase in income, their health may improve substantially due to better access to healthcare, nutrition, and living conditions. In contrast, a $25,000 increase in income for a millionaire is unlikely to produce a comparable change in health outcomes.
This illustrates diminishing returns. A linear model would fail to capture this pattern, suggesting that the same increase would have the same effect for both individuals. A non-linear model, such as a log-log specification, would be more appropriate. The millionaire’s income increases by only a small percentage, whereas the lower-income individual’s income doubles. To achieve a similar improvement in health, the millionaire would need a much larger proportional increase in income.
Conclusion
Non-linear models play a crucial role in answering many statistical questions. Understanding when to apply these models, and how to evaluate their fit, is essential for accurately representing real-world relationships and becoming a well-rounded statistician.

Leave a Reply