
By Oluwanifemi Kayode-Alese
Welcome aboard the data express! 🚀 Today, we’re diving into the world of R, a statistical programming language that’s here to make data analysis easy. Buckle up as we explore how to unleash the potential of your datasets, uncovering insights and trends in your dataset that might just blow your mind.
Setting Sail in RStudio: Navigating Uploading Data
Let’s say you’ve got a treasure trove of data waiting to be analyzed. The gateway to your data adventure is ? RStudio! This powerhouse integrated development environment (IDE) is your ship, and CSV(Comma-Separated Values) files are your treasure maps. A simple “read.csv “command, and voila, your dataset (let’s call it ‘df’ for Data Fiesta) is ready for exploration.
Ahoy, Explorers! Glimpsing the Unknown
But hold on, before we set sail, let’s equip ourselves with some tools for the journey. view(df) opens a window to the dataset’s soul, glimpse(df) gives us a sneak peek, and colnames(df) unveils the identities of our dataset’s companions, the column names. Armed and ready, it’s time to set sail into the sea of data possibilities!
Visual Representation: Bringing Data to Life!
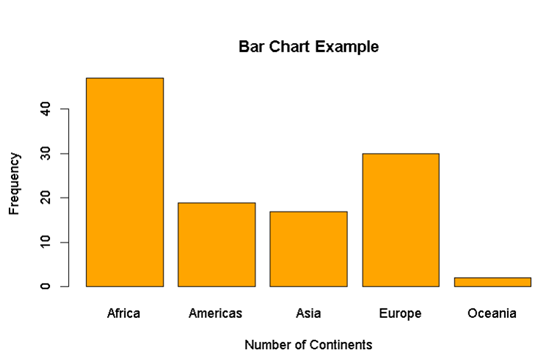
Now, let’s talk about the real magic – visual representation. Imagine turning raw data into vibrant, interactive stories. Scatter plots dance to the rhythm of numerical variables, bar charts showcase categorical tales, and boxplots unveil the dramatic saga of numerical vs. categorical showdowns(variables), and last but not least, the Mosaic Plot – the ensemble cast where two categorical variables take the stage!
Below are the visual representations of the basic R commands for these visual tools and its results;


For the visual representation of the Mosaic plot , I will using another dataset aside from “df”


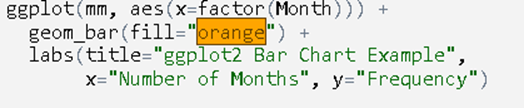
Unlocking Advanced Visualization: The ggplot2 Chronicles!
As our journey gets more thrilling, we stumble upon ggplot2 – the wizardry of data visualization. It’s not just about plotting; it’s about crafting a visual masterpiece. It adds customization, and a touch of wizardry to our plots. Think of it as the magic wand in our data wizard’s toolkit. For “ggplot”, we will be using more datasets to showcase the magic of its visualization, “ggplot” is unlocked by the “ggplot2” wizardry, and its syntax in RStudio is “library(ggplot2)” to be able to make use of it.
- Scatter plot:


c. Boxplot:


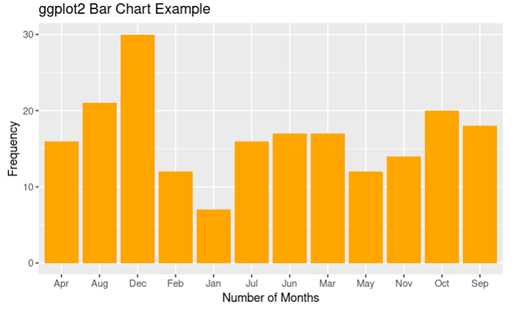
d. Mosaic Plot:

Conclusion: Your Data Odyssey Begins
As we wrap up this introduction, envision your data not as mere numbers but as characters in an epic novel waiting to be explored. The world of data awaits, and your adventure has just begun!
Ready to sail the seas of data with R? Let’s embark on this thrilling voyage together! 🌐📊✨
